Automatic Workout Analysis: How AI Extracts Actionable Insights from Every Ride
8 min read

Automatic workout analysis uses AI to clean ride data, compare it with your baseline, and turn each workout into one clear next training decision.
On this page
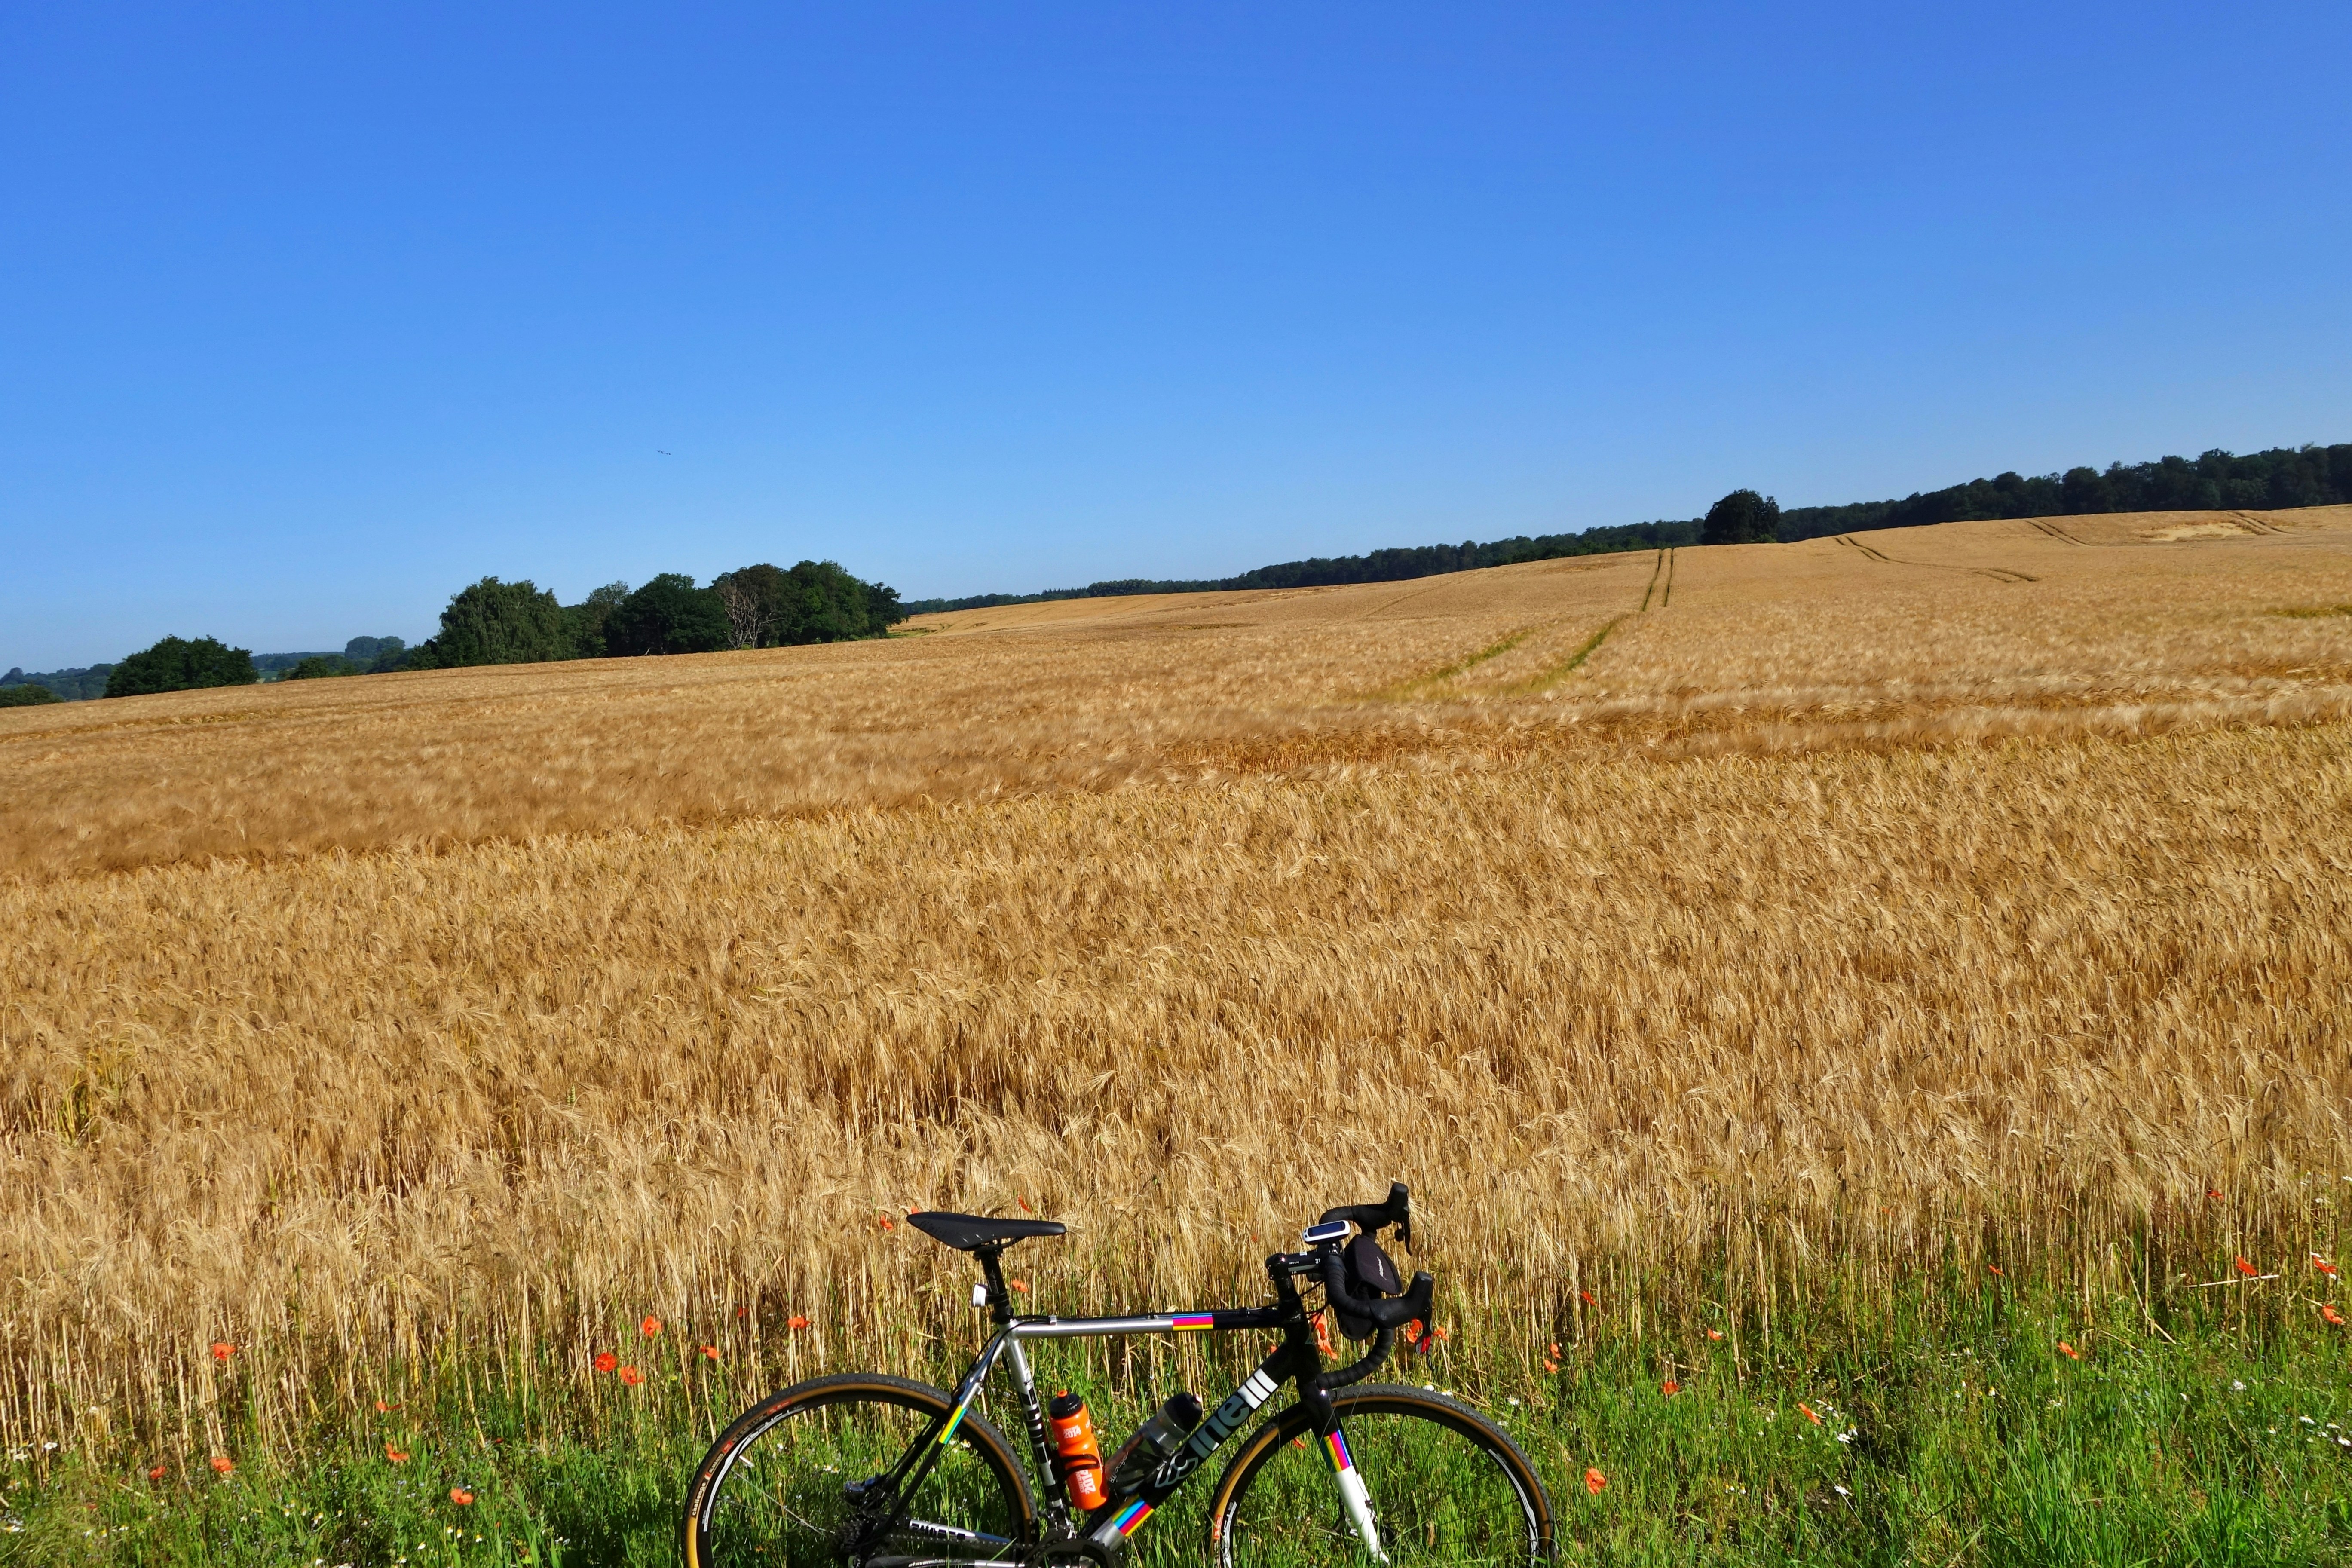
Photo by Ulf Meyer on Unsplash.
AI turns every ride into decisions by cleaning sensor data, comparing it to your baseline, and giving one clear next move.
Bike computers and wearables now record more than most riders can review by hand. Automatic workout analysis cuts that noise into a repeatable post-ride readout, so the gap between data and decision gets shorter.
Automatic analysis starts with the same streams you already record: power, heart rate, cadence, speed, grade, and ride notes. Power shows the work you put into the pedals, while heart rate shows how your body answered that load.
Cadence adds the rhythm of how you made the power, which can reveal a fading stroke before speed drops. GPS-derived speed and grade give the terrain frame, especially when wind, heat, traffic, or group pacing changes the ride.
For a deeper map of each field, use this guide to the metrics behind ride files before you judge a single flagged session. If your power trace looks odd, start with keeping your meter readings trustworthy before changing training.
Check power first for external load.
Read heart rate as the body response.
Use cadence to spot fading mechanics.
Use grade and speed to frame terrain.
Add notes for sleep, travel, heat, or illness.
Clean signals help AI turn every ride into one better decision.
Power is the stimulus, heart rate is the response, and cadence plus GPS give the context around both.
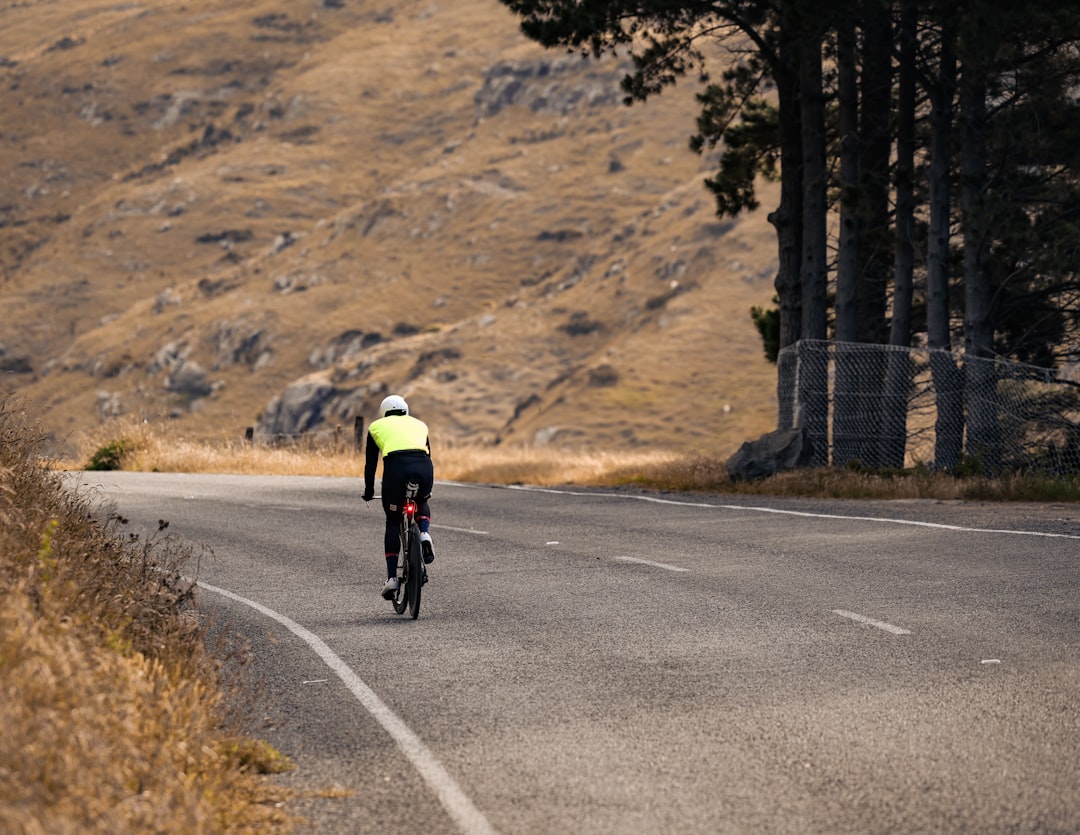
Photo by Diana Rafira on Unsplash.
The first job is not coaching. It is cleaning. The system aligns timestamps, removes obvious dropouts, and makes sure each stream sits on the same timeline.
Then it turns raw points into features a coach can use, such as interval shape, power consistency, intensity mix, and recovery markers. That step matters because a ride file is a stream, but a training choice needs a pattern.
Good tools also compare today with your own baseline, not with a faceless average rider. For example, lap-level ride review can show whether form faded during repeat work, while reading hard-ride power curves helps separate one peak from the whole session.
Clean dropouts before reading trends.
Align power, heart rate, and cadence.
Compare the ride with your baseline.
Flag odd data before changing load.
Turn patterns into one next step.
Automatic workout analysis pipelines: ingest, clean, synchronize, extract, model, contextualize, prescribe.
Data analysis is free, forever. The Dynamic Coach is Pro. Connected to Garmin, Strava, Whoop, and intervals.icu.
A useful report should not list every chart. It should tell you what happened, why it matters, and what to do next.
Look for three layers: workout completion, signal quality, and training effect. Completion tells you whether the planned work happened, signal quality shows whether the data can be trusted, and training effect frames the next session.
This is where automatic analysis saves time without removing judgment. A report can surface steady versus surgey ride patterns, then you decide whether those surges matched the goal or came from messy pacing.
Ask what changed from baseline.
Check whether sensors were sound.
Read intervals before total load.
Use notes to explain outliers.
Choose the next session from the pattern.
The report should compress the ride into a next decision, not hand you a second workout to decode.
AI can clean a file, but it cannot feel the headwind, the bad sleep, or the tense commute unless you record it. That gap is why context notes still matter.
Sensor errors also matter because bad inputs can create neat but false outputs. A heart-rate strap may slip, a power meter may drift, or GPS may misread a wooded climb.
Models can also overread a rare ride. A hot August race, a travel week, or a borrowed bike may look like a fitness change when it is really a context change. Use indoor and outdoor data differences when conditions shift across similar workouts.
Do not treat one odd ride as a trend.
Check devices before blaming fitness.
Log weather, sleep, travel, and illness.
Review conflicts between power and heart rate.
Keep medical questions with clinicians.
The goal is not blind trust, but a cleaner path from data to decision.
One tactical email with training ideas and product updates. No spam — unsubscribe anytime.
Keep reading
- Pedal Smoothness and Left–Right Power Balance: What Cyclists Should Actually Track — Learn when pedal smoothness and left-right power balance matter, how to test them cleanly, and what to track before changing your cycling plan.
- Reading a Failed Interval Set in N+One: What the Coach Learns From a DNF Session — A failed interval set is data, not defeat. Learn how N+One reads a DNF session, checks power, cadence, HR, recovery, and picks one next move.
- Normalized Power vs Average Power: Reading the Real Stress of a Cycling Workout — Learn when to use Normalized Power vs average power, how to read the gap between them, and how to adjust cycling training after variable efforts.
If your report shows rising fatigue flags, weaker repeat quality, or unusual heart-rate response, do not scrap the whole plan. Keep the key work, cut the load, and give the system cleaner feedback.
For the next seven days, keep intensity but trim total volume. Use two sub-threshold sessions and one longer easy aerobic ride, then compare the same signals on day eight.
This is not a punishment week. It is a short reset that preserves the training signal while reducing background strain. If repeat power steadies and the flags clear, build volume back with care.
Keep intensity targets in the plan.
Cut total volume by 20% for seven days.
Ride two sub-threshold sessions.
Add one easy long aerobic ride.
Reassess on day eight.
Decisive next move: keep intensity, cut volume 20% for seven days, then reassess.
Treat the AI output as one sensor inside the larger coaching system. It should sit beside perceived effort, sleep, life stress, and what you felt on the bike.
When signals agree, act with confidence. When signals conflict, slow the change down and look for the missing context before you rewrite the week.
For example, a cadence drop can mean fatigue, gearing choice, terrain, or a deliberate low-rpm effort. Use cadence trends across a workout and pedaling balance clues to read the pattern before drawing a hard line.
Use readiness scores as one input.
Pair AI flags with perceived effort.
Write short notes after odd rides.
Hold changes when signals conflict.
Let trends outweigh single-day noise.
The training system works best when machine signals and rider context check each other.
Day 1: Review your last ride report and name the main flag: weaker repeat quality, unusual heart-rate response, poor sensor quality, or lower readiness.
Days 1–7: Reduce planned weekly volume by 20% while keeping the scheduled intensity targets that matter most.
During the week: Complete two sub-threshold sessions, such as two steady hard efforts with easy recovery between them, and one longer aerobic ride at conversational pace.
After each ride: Review automatic flags for heart-rate drift, reduced power consistency, abnormal HRV trends, or sensor issues before judging fitness.
Daily: Log short context notes for sleep, travel, illness, heat, equipment changes, and stress so the model has cleaner context.
Day 8: Compare normalized power, heart-rate response, and repeat quality with the prior week, then restore volume if the flags clear.
If flags persist: Hold volume steady and seek coach or clinician input when symptoms, illness, or health concerns are involved.
Automatic workout analysis turns every ride into decisions by cleaning the file, comparing it with your baseline, and naming the next best step. Use the seven-day reset when the signals look noisy, then let the next ride confirm the choice.
No. AI can sort signals fast and make the next decision clearer, but coaching still needs context, judgment, and long-term goal setting.
No. Use clinicians for medical questions, symptoms, diagnosis, medication concerns, or any health issue that sits beyond training guidance.
Check sensor quality, device setup, and ride context first. If the data was clean, compare the pattern with nearby rides before changing the whole plan.
No. Power, heart rate, cadence, and GPS give a strong base, while HRV, sleep, and notes improve context when they are recorded consistently.